Note
Go to the end to download the full example code.
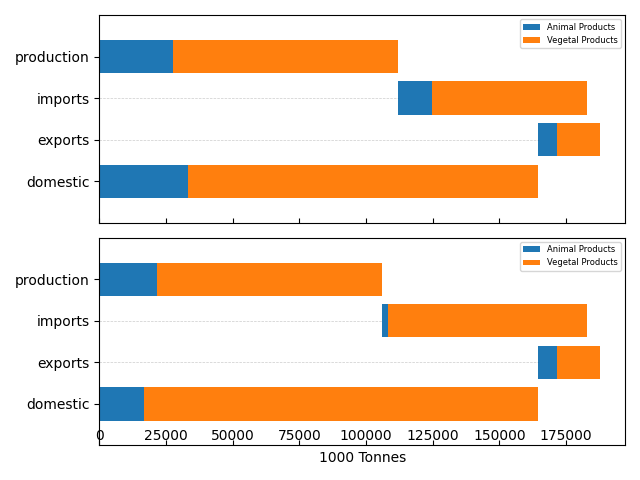
Reducing UK’s animal product consumption
This example demonstrates how to combine a Food Balance Sheet array with a
scaling model to reduce animal product consumption, while keeping total
consumption constant across all items.
It also employs a few fbs accessor class functions to group and plot
food balance sheet arrays.
Consumption of animal based products is halved, while keeping total comsumed weight constant by upscaling the consumption of vegetal products.
import numpy as np
from matplotlib import pyplot as plt

from agrifoodpy_data.food import FAOSTAT
from agrifoodpy.food.model import balanced_scaling
# Select food items and production values for the last year of data in the UK
# Values are in 1000 Tonnes
country_code = 229
food_uk = FAOSTAT.isel(Year=-1).sel(Region=country_code)

# Select all Animal Products according to its Item_origin, which is a
# non-dimension coordinate
animal_items = food_uk.sel(Item=food_uk.Item_origin=="Animal Products").Item.values
# Scale domestic use of animal items by a factor of 0.5, while keeping
# the sum of domestic use constant. Reduce imports to account for the new
# consumption values and use production as fallback, subtracting any negative
# excess if required

food_uk_scaled = balanced_scaling(
    food_uk,
    element="domestic",
    scale=0.5,
    items=animal_items,
    constant=True,
    origin="imports",
    fallback="production",
    add_to_fallback=False
)

# We group the original and scaled quantities by origin and plot to compare
food_uk_origin = food_uk.fbs.group_sum("Item_origin")
food_uk_scaled_origin = food_uk_scaled.fbs.group_sum("Item_origin")
From the plot we can see that domestic use of animal products is reduced by
half, while keeping total weight constant. We used production as the
fallback for any extra origin required. If any domestic use reduction
requires more origin reduction than available, the remaining is taken from
the fallback DataArray element.
# Plot and compare values before and after
f, axes = plt.subplots(2,1, sharex=True)
plt.subplots_adjust(hspace=0)

food_uk_origin.fbs.plot_bars(show="Item_origin",
                                  elements=["production", "imports"],
                                  inverted_elements=["exports", "domestic"],
                                  labels="show", ax=axes[0])

food_uk_scaled_origin.fbs.plot_bars(show="Item_origin",
                                  elements=["production", "imports"],
                                  inverted_elements=["exports", "domestic"],
                                  labels="show", ax=axes[1])

axes[1].set_xlabel("1000 Tonnes")
plt.tight_layout()

plt.show()
Total running time of the script: (0 minutes 0.847 seconds)